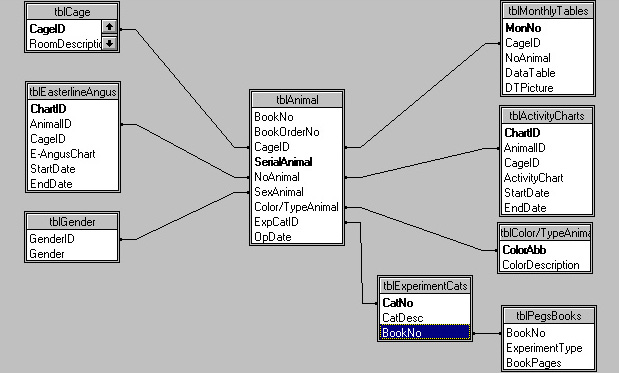

Digital scans should be made of each Easterline Angus and activity chart, of the log books, and of the rat registers and "Peg's books." All data from logbooks should be triple-keyed (to insure accuracy) into ASCII comma-delimited files to facilitate downloading. The logbook pages should also be scanned in order to preserve the hand-written marginal notes. Although the activity charts were derived from the logbook data, the activity charts should be preserved in digital form because they also contain marginal notes interpreting the experimental results. The Easterline Angus charts would only exist in scanned image form, not in digital data form for downloading. The majority of information in the rat and Peg's books would be included in the database, because they are lists which the relational database uses to relate animals to the experiments in which they participated. These records should also exist as scanned images, because they are copiously annoted with handwritten notes by Richter and others.
See Intellectual description of the data for a description of the record types referred to above.
Both of these tables contain searchable data on the date range covered by the chart. With these basic tables and relationships, the user can search the data in various ways. The data can be searched by experiment type, starting with a scrolling list made from tblExperimentCats, which then leads thru tblAnimal to either of the three data forms: tblActivityCharts, tblEasterlineAngus, or tblMonthlyTables. If the objective is to find data referenced in a publication, then tblAnimal can be searched by animal and/or cage number-year to find the EA charts, the Monthly log book data, or the activity charts made from the log book data.

Example of how to use the database